By Olivia Smith
How much does it cost for our state government to provide essential services to Hoosiers every year? What share of our budget is funded by federal dollars versus state revenue? And where do you go to find this information? This week, we’re diving into the numbers and looking at how Indiana has been spending its money this biennium.
In last week’s blog we walked through how our state’s legislative and executive branches work together to craft Indiana’s biennial (two-year) budget. Now let’s look at the nuts and bolts of our current budget that runs from FY 2023 through FY 2025 (ends June 30th 2025) as we prepare for a new budget this legislative session.
Federal Dollars Versus State Revenue
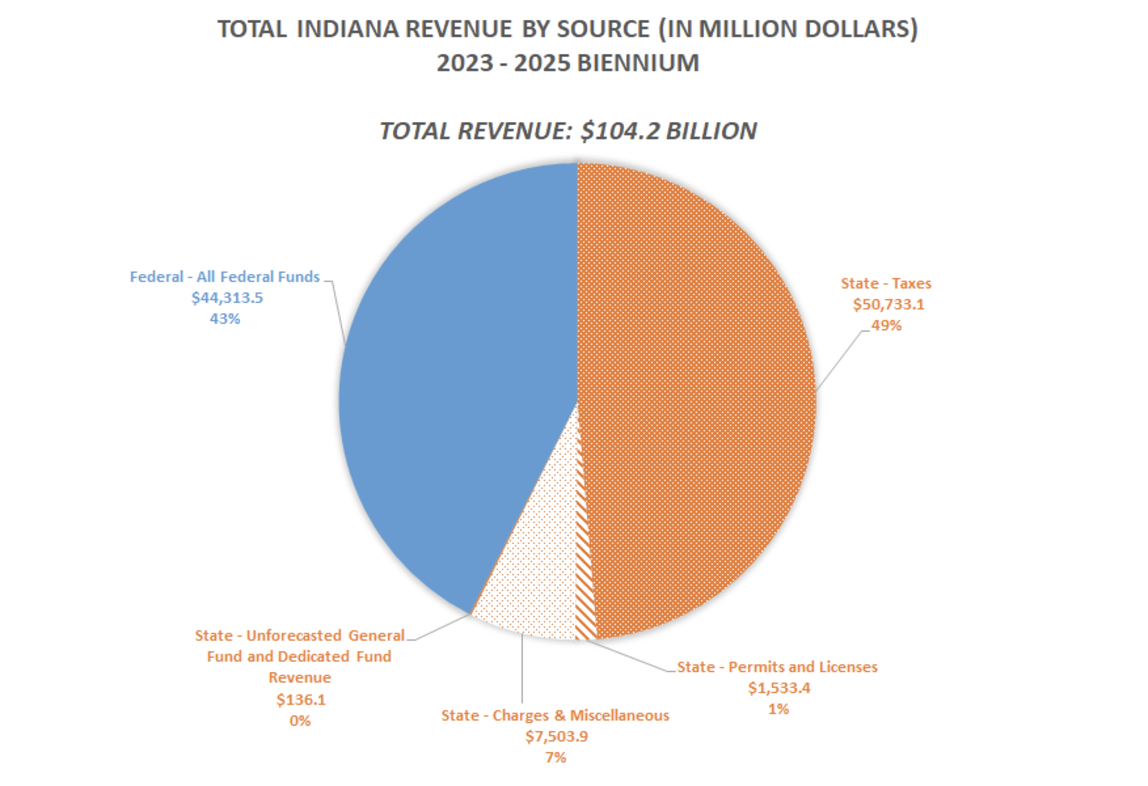
One reason that understanding our state budget can be so confusing is that there are many different funding streams that finance our state services, and depending on which subset of funding streams you look at, you will get a different story. Let’s begin by looking at the difference between state funds and federal funds. While we’ve talked about how much Indiana collects in state tax revenue, that’s not the only source of funding in our state budget. Out of the total $104.2 billion dollars that makes up our total state revenue during the past biennium, $44.3 billion of those dollars are federal funds, which makes up 43% of the total revenue! Revenue from state sources (including taxes, permit and licensing fees, charges, and other miscellaneous) totals $53.5 billion over the biennium.

Source: Author’s calculations based on data from Indiana State Budget Agency
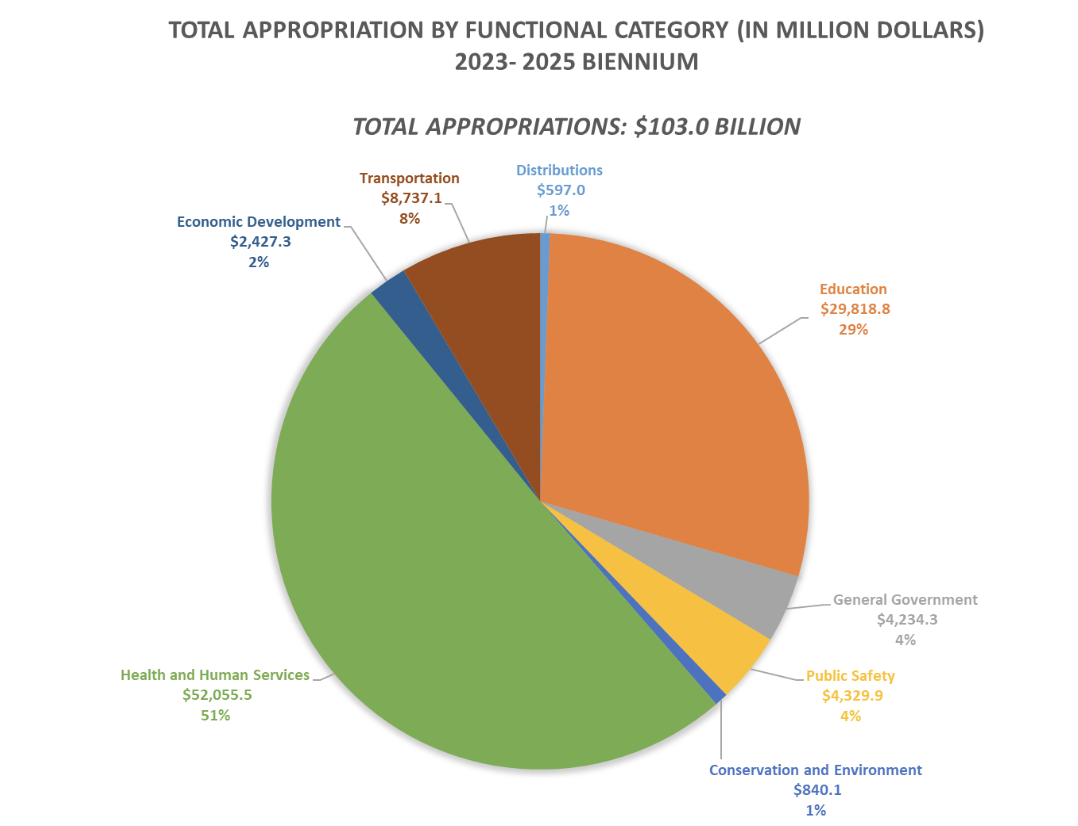
Now let’s dive down further and see how all that revenue is being appropriated, which is just the government finance term for allocating money for specific purposes. The chart below shows a breakdown of how that total revenue has been allocated by functional category.

Source: Author’s calculations based on data from Indiana State Budget Agency
We can see here that just over half of our total state appropriations go to health and human services. This includes funding for Medicaid services and state agencies like the Family and Social Services Administration that administer programs that support public health. The next largest share of our spending goes to education, which accounts for another 29% of our total spending; the largest individual appropriation in Indiana’s state budget is actually the funding for K-12 schools throughout the state.
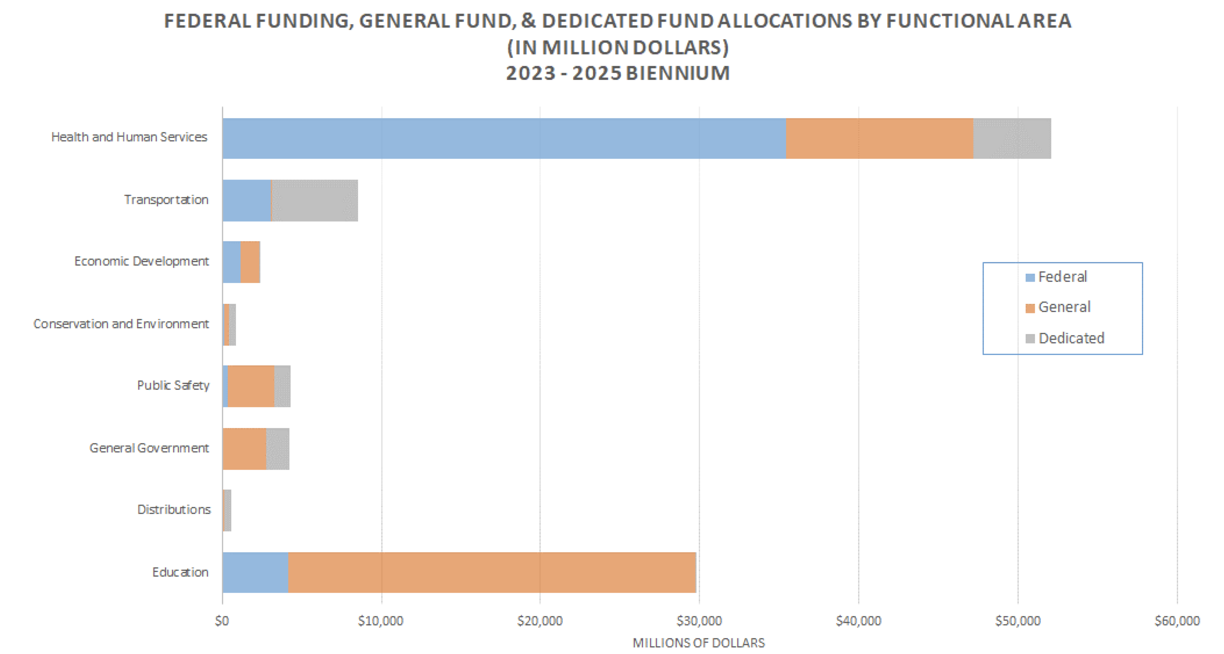
What these charts do not show, however, is how the different types of revenue actually funnel into the functional categories. While we saw that federal funds contribute to about 43% of our total funding this biennium, about 80% of that federal funding goes to the health and human services bucket. Education and transportation received the next highest shares of federal funds at about 9% and 7%, respectively.
Within our state dollars, there are distinctions made between money in our general fund versus in dedicated funds. The general fund is the primary fund used by our state to pay for government activities, and covers all allocations that are not ties to special-purpose, or dedicated funds. General fund dollars give lawmakers a lot of flexibility in how they choose to utilize them, but dedicated funds have pre-specified, limited uses. One area that has a lot of dedicated funding is transportation, so even if a policy desire arose, the dollars from those dedicated funds cannot be repurposed for other uses by the General Assembly. The chart below brings all of these distinct dollar types together to show, for each functional area, what share of the total funding comes from each source type.

Source: Author’s calculations based on data from Indiana State Budget Agency
This chart makes it clear that different functional areas of our state government receive very different mixes of federal, general, and dedicated funds. By understanding how each of these areas is funded, we can better understand both the opportunities and challenges posed by policy changes.
Where can I learn more?
The Indiana State Budget Agency website houses the current biennial budget, historical budget information, and shows updates as they develop the FY2026 – FY 2027 budget. While this post has focused on high-level analysis of our most recent budget, there is a lot more detail available about individual allocations, breakdowns of functional categories, and different expense types on the SBA website.
TL;DR: Out of the total $104.2 billion dollars that makes up our total state revenue during the past biennium, $44.3 billion of those dollars are federal funds, while revenue from state sources totals $53.5 billion. Just over half of our total state appropriations go to Health and Human services and another 29% of our spending goes to Education. The largest individual appropriation in Indiana’s state budget is actually the funding for K-12 schools throughout the state. Different types of funding sources (federal, general, and dedicated) actually funnel into the functional categories in distinct ways. By understanding how each of these areas is funded, we can better understand both the opportunities and challenges posed by policy changes. For further research, the Indiana State Budget Agency website has both high-level and detailed information about our budget available for the public.
This blog post was funded by the Annie E. Casey Foundation. We thank them for their support but acknowledge that the findings and conclusions presented in this are those of the author alone, and do not necessarily reflect the opinions of the Foundation.
